Medicare Advantage plans not returning in 2027: the data for reporters
Published 2026-10-29 · Counts from the CMS files as built 2026-11-16 · Free to republish (CC BY 4.0)
On this page: Toolkit The paragraph Downloads Story angles Ending vs. merged State briefs By state Counties Organizations Embed Map Method Contact
County-by-county counts of the Medicare Advantage plans that are not returning, changing and new for 2027, from the federal plan files CMS released before Open/Annual Enrollment. Every state, every county and every metro area, with a paragraph to paste, charts and CSVs you can republish, and a lookup your readers can use. No sign-up, no ads.
The reporter's toolkit
Free, no sign-up, no ads. Built for deadline: localize, check, chart and embed in minutes.
The numbers in a paragraph
Paste it as is, or take what you need. Please keep the credit: it links readers to the county list.
Source: MyMedicarePlans.org analysis of CMS Medicare Advantage Landscape files for 2026 and 2027 (https://mymedicareplans.org/newsroom/)
Free to republish
The charts and data on this page are free to use under Creative Commons Attribution 4.0: credit MyMedicarePlans.org with a link to this page. The CSV files carry each county's FIPS code, so they drop straight into Datawrapper, Flourish or any mapping tool.
All counties (CSV)All states (CSV)Chart (PNG)
Cite this dataset: MyMedicarePlans Data Desk. Medicare Advantage plans not returning and changing for 2027, by county and state. Zenodo. https://doi.org/10.5281/zenodo.24118198 (the DOI always leads to the latest version).
Story angles in the data
- Fewer choices in 62% of counties. 1,944 of 3,159 counties will have fewer Medicare Advantage plans in 2027 than in 2026. Every county's count is in the CSV, with its FIPS code for mapping.
- Where the largest shares are lost. All 25 counties losing the largest share of their plans are outside any metropolitan area. The top three: Harmon County, Oklahoma, where 14 of its 16 plans (88%) are not returning; Morrison County, Minnesota, where 19 of its 22 plans (86%) are not returning; Renville County, Minnesota, where 18 of its 21 plans (86%) are not returning.
- Half the plans gone. In 267 counties with 10 or more plans in 2026, at least half of them are not returning for 2027.
- Where the most plans are leaving. Henry County, Ohio, where 41 of its 83 plans (49%) are not returning; Wyandot County, Ohio, where 40 of its 81 plans (49%) are not returning; Van Wert County, Ohio, where 40 of its 82 plans (49%) are not returning.
- Whole organizations leaving. 32 organizations (by the name in the CMS file) have no Medicare Advantage plan anywhere in 2027, and in 37 states at least one organization leaves the state entirely.
- The deadline that is not December 7 for everyone. People whose plan is not renewed have until the end of February 2027 to choose another, through a Special Enrollment Period; a story that says everyone must act by December 7 overstates the deadline.
Ending outright vs. merged: who has to act
The counties where the most plans end outright (counties with 10 or more plans):
| County | State | Not returning | Ending outright | Merged |
|---|---|---|---|---|
| Crawford County | Ohio | 36 | 31 | 5 |
| Henry County | Ohio | 41 | 30 | 11 |
| Wyandot County | Ohio | 40 | 30 | 10 |
| Van Wert County | Ohio | 40 | 29 | 11 |
| Paulding County | Ohio | 39 | 29 | 10 |
| Clark County | Washington | 30 | 29 | 1 |
| Collin County | Texas | 37 | 28 | 9 |
| Ross County | Ohio | 36 | 27 | 9 |
| Clear Creek County | Colorado | 31 | 27 | 4 |
| Harris County | Texas | 37 | 26 | 11 |
Your state's brief
Each brief has the state's paragraph, every county, its metro areas, a chart and a CSV. Metro-area briefs group the counties the way local newsrooms cover them.
Arizona
Arkansas
California
Colorado
Connecticut
Delaware
District of Columbia
Florida
Georgia
Hawaii
Idaho
Illinois
Indiana
Iowa
Kansas
Kentucky
Louisiana
Maine
Maryland
Massachusetts
Michigan
Minnesota
Mississippi
Missouri
Montana
Nebraska
Nevada
New Hampshire
New Jersey
New Mexico
New York
North Carolina
North Dakota
Ohio
Oklahoma
Oregon
Pennsylvania
Puerto Rico
Rhode Island
South Carolina
South Dakota
Tennessee
Texas
Utah
Vermont
Virginia
Washington
West Virginia
Wisconsin
Wyoming
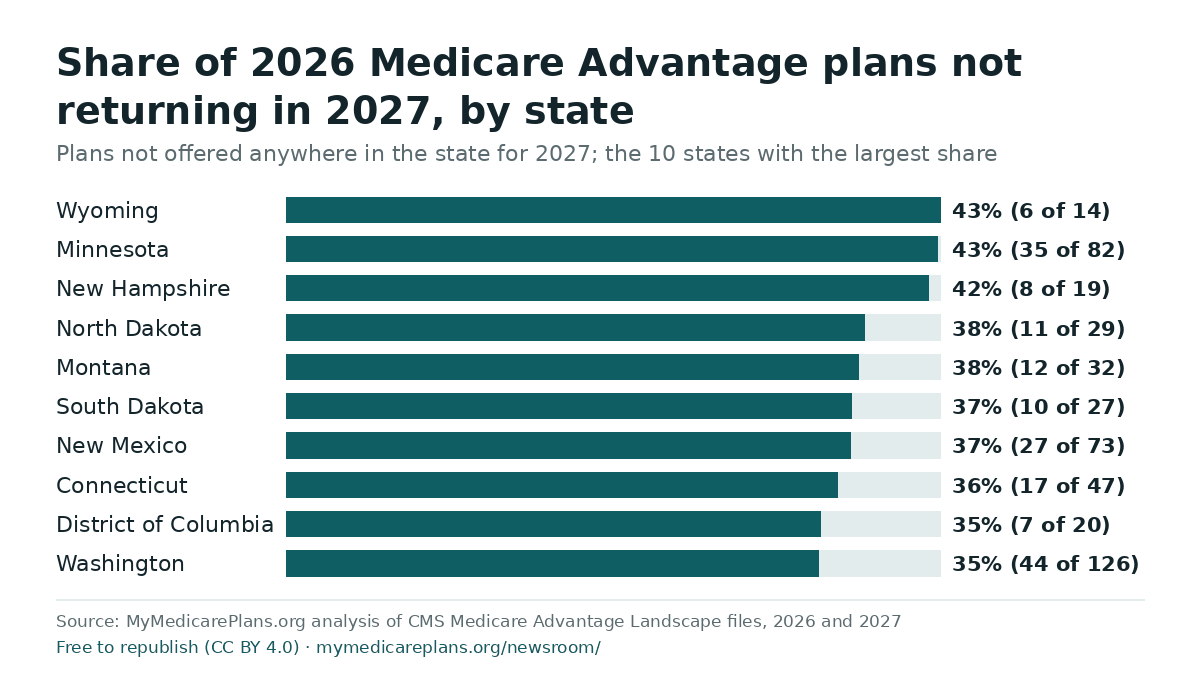
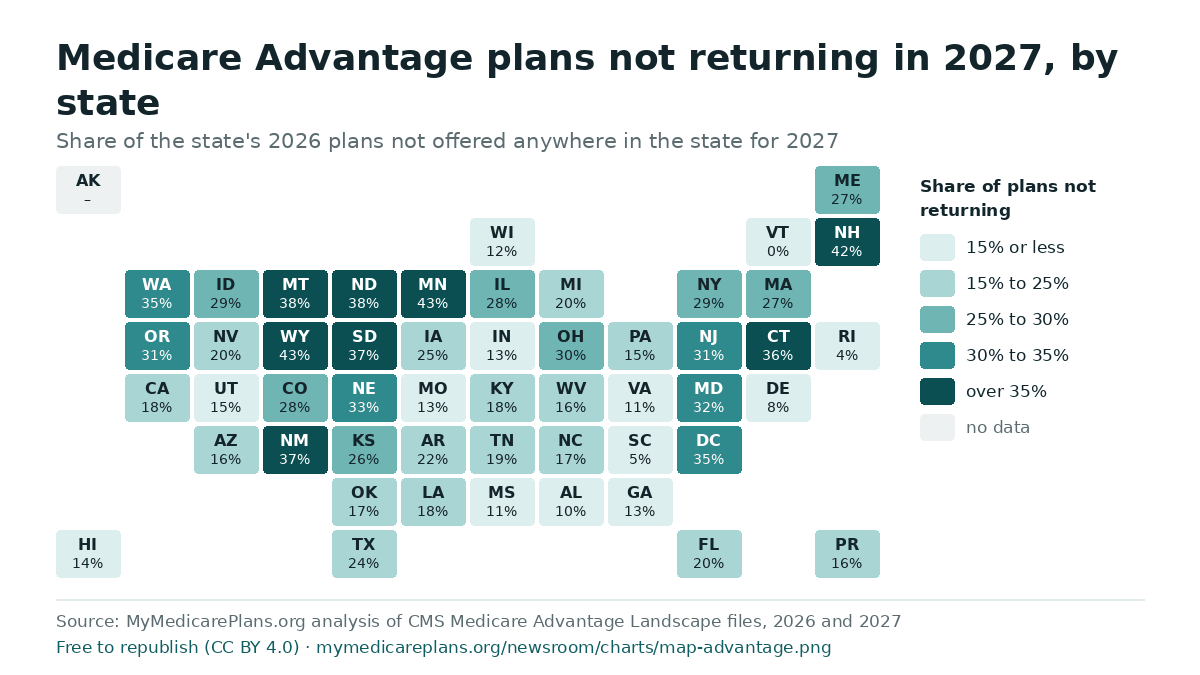
States, by share of plans not returning
| State | Plans 2026 | Not returning | Share | Changing | New | Counties with fewer plans |
|---|---|---|---|---|---|---|
| Wyoming | 14 | 6 | 43% | 4 | 0 | 2 of 23 |
| Minnesota | 82 | 35 | 43% | 41 | 19 | 86 of 87 |
| New Hampshire | 19 | 8 | 42% | 9 | 9 | 4 of 10 |
| North Dakota | 29 | 11 | 38% | 16 | 5 | 53 of 53 |
| Montana | 32 | 12 | 38% | 16 | 3 | 37 of 50 |
| South Dakota | 27 | 10 | 37% | 15 | 11 | 64 of 66 |
| New Mexico | 73 | 27 | 37% | 43 | 15 | 31 of 33 |
| Connecticut | 47 | 17 | 36% | 26 | 18 | 8 of 8 |
| District of Columbia | 20 | 7 | 35% | 10 | 2 | 1 of 1 |
| Washington | 126 | 44 | 35% | 70 | 33 | 37 of 39 |
| Nebraska | 54 | 18 | 33% | 29 | 16 | 77 of 93 |
| Maryland | 63 | 20 | 32% | 26 | 4 | 24 of 24 |
| Oregon | 101 | 31 | 31% | 57 | 25 | 15 of 30 |
| New Jersey | 85 | 26 | 31% | 49 | 12 | 13 of 21 |
| Ohio | 212 | 63 | 30% | 129 | 31 | 86 of 88 |
| Idaho | 48 | 14 | 29% | 29 | 10 | 35 of 44 |
| New York | 218 | 63 | 29% | 135 | 69 | 58 of 62 |
| Colorado | 107 | 30 | 28% | 69 | 27 | 47 of 64 |
| Illinois | 160 | 44 | 28% | 104 | 23 | 95 of 102 |
| Massachusetts | 103 | 28 | 27% | 67 | 22 | 8 of 14 |
| Maine | 52 | 14 | 27% | 32 | 12 | 16 of 16 |
| Kansas | 87 | 23 | 26% | 56 | 16 | 62 of 101 |
| Iowa | 73 | 18 | 25% | 47 | 19 | 52 of 99 |
| Texas | 423 | 102 | 24% | 275 | 100 | 197 of 254 |
| Arkansas | 91 | 20 | 22% | 64 | 13 | 59 of 75 |
| Michigan | 192 | 39 | 20% | 142 | 28 | 67 of 83 |
| Florida | 611 | 124 | 20% | 367 | 73 | 58 of 67 |
| Nevada | 105 | 21 | 20% | 65 | 14 | 2 of 11 |
| Tennessee | 132 | 25 | 19% | 101 | 48 | 44 of 95 |
| Kentucky | 114 | 21 | 18% | 84 | 30 | 31 of 120 |
| California | 402 | 74 | 18% | 274 | 66 | 26 of 56 |
| Louisiana | 111 | 20 | 18% | 85 | 33 | 22 of 64 |
| Oklahoma | 82 | 14 | 17% | 55 | 13 | 67 of 77 |
| North Carolina | 175 | 29 | 17% | 130 | 33 | 69 of 100 |
| West Virginia | 69 | 11 | 16% | 48 | 12 | 21 of 55 |
| Puerto Rico | 63 | 10 | 16% | 17 | 10 | 0 of 78 |
| Arizona | 133 | 21 | 16% | 89 | 36 | 6 of 15 |
| Pennsylvania | 332 | 50 | 15% | 257 | 56 | 34 of 67 |
| Utah | 55 | 8 | 15% | 42 | 4 | 16 of 29 |
| Hawaii | 44 | 6 | 14% | 34 | 8 | 1 of 5 |
| Missouri | 157 | 21 | 13% | 120 | 38 | 43 of 115 |
| Georgia | 166 | 22 | 13% | 119 | 17 | 109 of 159 |
| Indiana | 127 | 16 | 13% | 98 | 29 | 52 of 92 |
| Wisconsin | 121 | 15 | 12% | 85 | 11 | 59 of 72 |
| Virginia | 143 | 16 | 11% | 106 | 21 | 31 of 133 |
| Mississippi | 93 | 10 | 11% | 76 | 19 | 7 of 82 |
| Alabama | 98 | 10 | 10% | 80 | 25 | 2 of 67 |
| Delaware | 37 | 3 | 8% | 30 | 4 | 2 of 3 |
| South Carolina | 95 | 5 | 5% | 75 | 7 | 1 of 46 |
| Rhode Island | 23 | 1 | 4% | 19 | 0 | 5 of 5 |
| Vermont | 3 | 0 | 0% | 2 | 2 | 2 of 6 |
The 25 counties losing the largest share of their plans
Counties with 10 or more plans in 2026.
| # | County | State | Plans 2026 | Plans 2027 | Not returning | Share | Changing | New |
|---|---|---|---|---|---|---|---|---|
| 1 | Harmon County | Oklahoma | 16 | 3 | 14 | 88% | 2 | 1 |
| 2 | Morrison County | Minnesota | 22 | 7 | 19 | 86% | 2 | 4 |
| 3 | Renville County | Minnesota | 21 | 5 | 18 | 86% | 2 | 2 |
| 4 | Lake of the Woods County | Minnesota | 14 | 2 | 12 | 86% | 2 | 0 |
| 5 | Campbell County | South Dakota | 18 | 7 | 15 | 83% | 2 | 4 |
| 6 | Corson County | South Dakota | 18 | 7 | 15 | 83% | 2 | 4 |
| 7 | Walworth County | South Dakota | 18 | 7 | 15 | 83% | 2 | 4 |
| 8 | Chippewa County | Minnesota | 12 | 6 | 10 | 83% | 2 | 4 |
| 9 | Brown County | Minnesota | 17 | 5 | 14 | 82% | 3 | 2 |
| 10 | Crow Wing County | Minnesota | 11 | 2 | 9 | 82% | 2 | 0 |
| 11 | Martin County | Minnesota | 11 | 5 | 9 | 82% | 2 | 3 |
| 12 | Wadena County | Minnesota | 11 | 2 | 9 | 82% | 2 | 0 |
| 13 | Franklin County | Nebraska | 32 | 24 | 26 | 81% | 5 | 18 |
| 14 | Valley County | Nebraska | 32 | 24 | 26 | 81% | 5 | 18 |
| 15 | Webster County | Nebraska | 32 | 24 | 26 | 81% | 5 | 18 |
| 16 | Swift County | Minnesota | 16 | 9 | 13 | 81% | 2 | 6 |
| 17 | Redwood County | Minnesota | 15 | 5 | 12 | 80% | 3 | 2 |
| 18 | Todd County | Minnesota | 15 | 7 | 12 | 80% | 2 | 4 |
| 19 | Beaver County | Oklahoma | 10 | 3 | 8 | 80% | 2 | 1 |
| 20 | Cimarron County | Oklahoma | 10 | 3 | 8 | 80% | 2 | 1 |
| 21 | Roger Mills County | Oklahoma | 10 | 3 | 8 | 80% | 2 | 1 |
| 22 | Garfield County | Nebraska | 29 | 13 | 23 | 79% | 5 | 7 |
| 23 | Greeley County | Nebraska | 29 | 21 | 23 | 79% | 5 | 15 |
| 24 | Alamosa County | Colorado | 14 | 4 | 11 | 79% | 3 | 1 |
| 25 | Haakon County | South Dakota | 14 | 7 | 11 | 79% | 2 | 4 |
The 25 counties losing the most plans
| # | County | State | Plans 2026 | Plans 2027 | Not returning | Share | Changing | New |
|---|---|---|---|---|---|---|---|---|
| 1 | Henry County | Ohio | 83 | 57 | 41 | 49% | 32 | 15 |
| 2 | Wyandot County | Ohio | 81 | 55 | 40 | 49% | 31 | 14 |
| 3 | Van Wert County | Ohio | 82 | 60 | 40 | 49% | 32 | 18 |
| 4 | Paulding County | Ohio | 81 | 58 | 39 | 48% | 32 | 16 |
| 5 | Collin County | Texas | 97 | 81 | 37 | 38% | 47 | 21 |
| 6 | Harris County | Texas | 114 | 99 | 37 | 32% | 62 | 22 |
| 7 | Polk County | Florida | 126 | 110 | 37 | 29% | 67 | 21 |
| 8 | Crawford County | Ohio | 71 | 48 | 36 | 51% | 26 | 13 |
| 9 | Ross County | Ohio | 82 | 60 | 36 | 44% | 36 | 14 |
| 10 | Champaign County | Ohio | 91 | 74 | 36 | 40% | 44 | 19 |
| 11 | Shelby County | Ohio | 92 | 74 | 35 | 38% | 45 | 17 |
| 12 | Miami County | Ohio | 100 | 82 | 35 | 35% | 54 | 17 |
| 13 | Preble County | Ohio | 89 | 74 | 34 | 38% | 44 | 19 |
| 14 | Darke County | Ohio | 91 | 74 | 34 | 37% | 45 | 17 |
| 15 | Ottawa County | Ohio | 95 | 79 | 34 | 36% | 50 | 18 |
| 16 | Brown County | Ohio | 96 | 79 | 34 | 35% | 51 | 17 |
| 17 | Morrow County | Ohio | 86 | 69 | 33 | 38% | 44 | 16 |
| 18 | Tuscarawas County | Ohio | 90 | 72 | 33 | 37% | 48 | 15 |
| 19 | Seneca County | Ohio | 93 | 75 | 33 | 35% | 48 | 15 |
| 20 | Fort Bend County | Texas | 94 | 83 | 33 | 35% | 48 | 22 |
| 21 | Orange County | Florida | 123 | 106 | 33 | 27% | 65 | 16 |
| 22 | Osceola County | Florida | 127 | 112 | 33 | 26% | 67 | 18 |
| 23 | Seminole County | Florida | 128 | 113 | 33 | 26% | 68 | 18 |
| 24 | Allen County | Ohio | 85 | 70 | 32 | 38% | 42 | 17 |
| 25 | Putnam County | Ohio | 85 | 68 | 32 | 38% | 42 | 15 |
Organizations leaving Medicare Advantage
No Medicare Advantage plan anywhere in 2027 (32): American Health Advantage of Texas, Anthem Blue Cross Life and Health Insurance Company, Aspirus Health Plan, Blue Cross and Blue Shield of IL, NM, OK, TX, Blue Cross and Blue Shield of Illinois, Blue Cross and Blue Shield of Montana, Blue Cross and Blue Shield of NM, TX, Blue Cross and Blue Shield of New Mexico, Blue Cross and Blue Shield of OK, TX, Blue Cross and Blue Shield of Oklahoma, Blue Cross and Blue Shield of Texas, Braven Health, CHRISTUS Health Advantage, CarePartners of Connecticut, CareSource, Central Health Medicare Plan, Clear Spring Health, ConnectiCare, Experience Health, Mass Advantage, Memorial Hermann Health Plan, Molina Healthcare of Nevada, NextBlue of North Dakota, Paramount Elite Medicare Plans, Patrius Health, Providence Medicare Advantage Plans, Saint Alphonsus Health Plan, Sharp Health Plan, UnitedHealthcare Community Plan, WellSense Health Plan, Wellmark Advantage Health Plan, iCircle Services of the Finger Lakes, Inc.
New to Medicare Advantage for 2027 (9): Healthy Arkansas, Inc., MedCare Partners Health Plan of Texas, Molina Healthcare of Iowa, Inc., Molina Healthcare of Nebraska, Molina Healthcare of New Mexico, MultiCare Health Plan Medicare Advantage Evergreen Plans, Native Advantage, Range Health, St. Luke's Health Plan.
Names as they appear in the CMS file; a parent company can still offer plans under another name. Each state brief lists the organizations leaving that state.
Put the county lookup on your site
Readers pick their county and see what changes for them. Paste this where the lookup should go; it works in any story page, newsletter archive or resource page, and needs no account.
<iframe src="https://mymedicareplans.org/embed/plan-changes/" title="Medicare Advantage plan changes for 2027, by county" width="100%" height="440" style="border:0;max-width:640px" loading="lazy" allowtransparency="true" data-mmp-embed></iframe>
<script src="https://mymedicareplans.org/embed/resize.js" async></script>
<p style="font:13px/1.4 sans-serif;margin:4px 0 0">Medicare Advantage plan changes for 2027 by county: <a href="https://mymedicareplans.org/newsroom/">MyMedicarePlans.org</a></p>
Tools and charts for your site
Free to embed or republish with the credit line (CC BY 4.0). The tools carry no ads and no tracking beyond a count of the sites that use them. Everything in one place: Charts & tools.
How the counts are made
Every number here comes from comparing the CMS Landscape file for 2026 and the CMS Landscape file for 2027 (the files CMS publishes before each Annual Enrollment Period), built 2026-11-16. Medicare Advantage plans only; stand-alone Part D drug plans are not counted.
- Not returning (a county): a plan offered in the county in 2026 and not offered there for 2027. A non-renewal, a contract ending and a plan shrinking its service area all count, because each means the plan is gone where the member lives.
- Not returning (a state, the nation): a plan offered somewhere in the state (the country) in 2026 and nowhere in it for 2027. A plan leaving some counties but not others counts in those counties, not statewide, so county counts do not add up to the state's.
- Changing: a plan offered both years with a different premium, drug deductible, plan type or name in at least one county it serves.
- New (a county): a plan offered in the county for 2027 that was not offered there in 2026.
- Plans: each contract, plan and segment in the CMS file counts once. Do not add the state figures for a national one: a plan sold in several states would be counted more than once.
- Organizations leaving: organizations, by the marketing name in the CMS file, with plans in 2026 and none for 2027 (in the state, or anywhere). A parent company can still offer plans under another name.
- Metro areas: the Office of Management and Budget's metropolitan statistical areas (July 2023 delineation, published by the Census Bureau). FIPS codes: the Census Bureau's 2020 county list.
The counts are area-level: no plan's premium or benefits are published here. A member's own changes are in the plan's Annual Notice of Change; Medicare.gov and 1-800-MEDICARE confirm any plan's status.
Embed the tables on this page
Every table here can go on your site: searchable, sortable, filterable, with the CSV a click away. Paste the code where the table should appear. It sizes itself to fit; add ?state=ohio to start on a state, or ?bg=transparent to sit on your page's own background. Fonts, colors and the rest: the Embed Studio.
Medicare Advantage plans not returning in 2027, by state
Every state: plans offered both years, the ones not returning, changing and new.
<iframe src="https://mymedicareplans.org/embed/table/medicare-advantage-states/" title="Medicare Advantage plans not returning in 2027, by state" width="100%" height="640" style="border:0" loading="lazy" allowtransparency="true" data-mmp-embed></iframe> <script src="https://mymedicareplans.org/embed/resize.js" async></script> <p style="font:13px/1.4 sans-serif;margin:4px 0 0">Medicare Advantage plans not returning in 2027, by state: <a href="https://mymedicareplans.org/newsroom/">MyMedicarePlans.org</a></p>Customize it Preview
Medicare Advantage plan changes for 2027, every county
Every county: the plans not returning, changing and new. Start it on a state.
<iframe src="https://mymedicareplans.org/embed/table/medicare-advantage-counties/" title="Medicare Advantage plan changes for 2027, every county" width="100%" height="640" style="border:0" loading="lazy" allowtransparency="true" data-mmp-embed></iframe> <script src="https://mymedicareplans.org/embed/resize.js" async></script> <p style="font:13px/1.4 sans-serif;margin:4px 0 0">Medicare Advantage plan changes for 2027, every county: <a href="https://mymedicareplans.org/newsroom/">MyMedicarePlans.org</a></p>Customize it Preview
Questions about the data
Write to [email protected]: a custom cut of the data (a county list, a region, a chart in your outlet's size) is usually a same-day reply.
For a quote or an interview, write to the same address and the desk that covers it answers: the Data Desk for the plan counts and the county data, the Costs & Policy Desk for Part D, premiums, IRMAA and Extra Help, the Editorial Desk for how Medicare works, Medigap and enrollment. Every answer comes from the CMS files and Medicare's own rules.
MyMedicarePlans.org is a Medicare guide: plain-language answers and plan data for people choosing coverage. The counts here come only from the CMS files, and the method is above. Not connected with or endorsed by the U.S. government or the federal Medicare program.