A non-government entityMyMedicarePlans
Data for reporters and researchers
HomeNewsroomTexas

Texas: Medicare Advantage plans not returning in 2027

Published 2026-10-29 · Counts from the CMS files as built 2026-11-16 · Free to republish (CC BY 4.0)

On this page: The paragraph Downloads Story angles Every county Ratings, insurers, Part D, Medigap Embed Method

102 of 423plans offered in 2026 that are not offered anywhere in the state for 2027
197 of 254counties with fewer plans in 2027 than in 2026
37 of 97plans not returning in Collin County, the county losing the most
7organizations leaving Medicare Advantage in Texas entirely

The numbers in a paragraph

Paste it as is, or take what you need. Please keep the credit: it links readers to the county list.

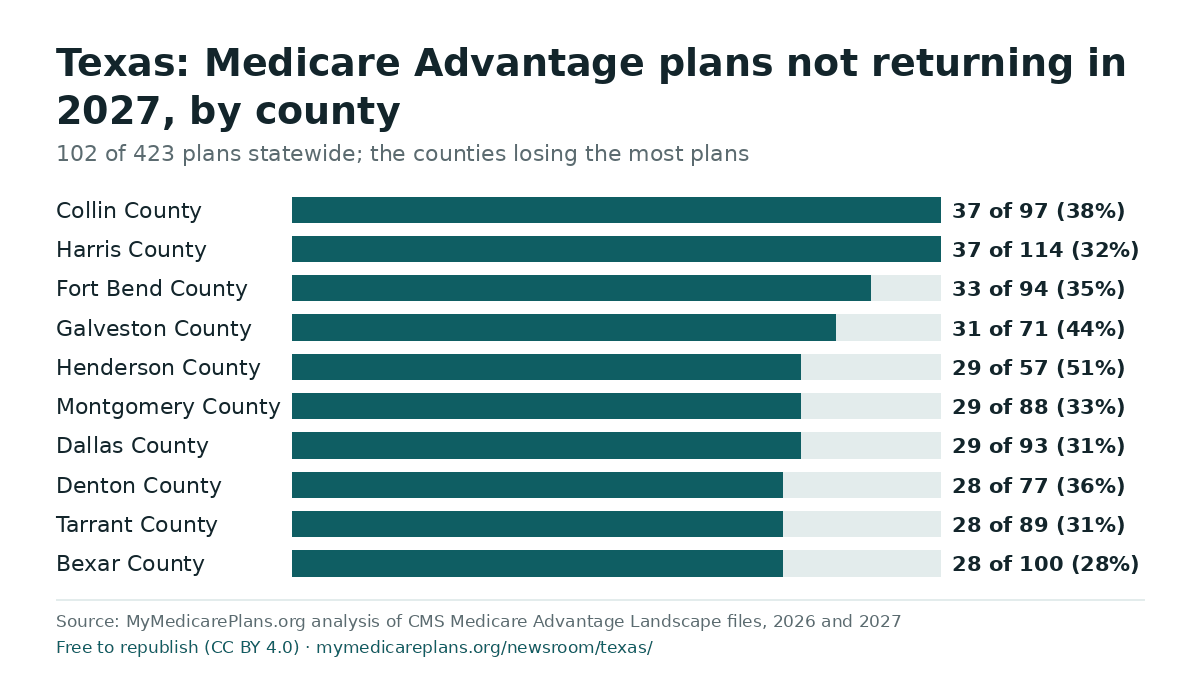
For 2027, 102 of the 423 Medicare Advantage plans offered in Texas in 2026 will not be offered anywhere in the state, and 275 more are changing their premium, drug deductible, plan type or name, according to a MyMedicarePlans.org analysis of the Centers for Medicare & Medicaid Services' plan files. 197 of the state's 254 counties will have fewer plans to choose from than in 2026. The county losing the most plans is Collin County, where 37 of its 97 plans (38%) are not returning. People can change plans during Open/Annual Enrollment, October 15 to December 7, 2026; anyone whose plan is not renewed for 2027 also has a Special Enrollment Period through the end of February 2027.

Source: MyMedicarePlans.org analysis of CMS Medicare Advantage Landscape files for 2026 and 2027 (https://mymedicareplans.org/newsroom/texas/)

Free to republish

The charts and data on this page are free to use under Creative Commons Attribution 4.0: credit MyMedicarePlans.org with a link to this page. The CSV files carry each county's FIPS code, so they drop straight into Datawrapper, Flourish or any mapping tool.

Texas counties (CSV)Chart (PNG)
Texas: Medicare Advantage plans not returning in 2027, by county

Story angles in the data

  1. Fewer choices in 197 of 254 counties. The number of Medicare Advantage plans falls in 197 of Texas's 254 counties between 2026 and 2027.
  2. Where the most plans are leaving. Collin County, where 37 of its 97 plans (38%) are not returning; Harris County, where 37 of its 114 plans (32%) are not returning; Fort Bend County, where 33 of its 94 plans (35%) are not returning.
  3. Ending outright, or merged. Of the 102 plans not returning in Texas, 67 end outright (members choose a new plan or return to Original Medicare) and 35 are merged into another plan under CMS's crosswalk (members are moved automatically). Each county's split is in the county CSV on the national page.
  4. The largest share lost. Kimble County, where 12 of its 19 plans (63%) are not returning.
  5. 7 organizations leaving the state. No Medicare Advantage plan in Texas for 2027 from: American Health Advantage of Texas, Blue Cross and Blue Shield of IL, NM, OK, TX, Blue Cross and Blue Shield of NM, TX, Blue Cross and Blue Shield of OK, TX, Blue Cross and Blue Shield of Texas, CHRISTUS Health Advantage, Memorial Hermann Health Plan (the names in the CMS file).
  6. What a non-renewal means for members. Members of a plan that is not renewing get a letter from it. Anyone who does not pick another plan returns to Original Medicare on January 1, 2027 and needs a Part D plan to keep drug coverage. People can change plans during Open/Annual Enrollment, October 15 to December 7, 2026; anyone whose plan is not renewed for 2027 also has a Special Enrollment Period through the end of February 2027.

Every county in Texas

Most plans not returning first. A county's name opens its page for readers, with the counts by plan type and what to do before the deadline.

CountyPlans 2026Plans 2027Not returningShareChangingNew
Collin County97813738%4721
Harris County114993732%6222
Fort Bend County94833335%4822
Galveston County71643144%3024
Henderson County57362951%248
Montgomery County88792933%4520
Dallas County93842931%5020
Denton County77672836%3918
Tarrant County89832831%4922
Bexar County100982828%5826
Comal County89832629%5020
Matagorda County50402550%2015
Kaufman County60462542%3011
Willacy County79662532%4012
Kendall County84742530%4815
Colorado County46372452%1715
Burnet County65542437%3613
Bandera County84752429%4715
Wilson County85752428%4814
Medina County86772428%4915
Kleberg County64512234%359
Caldwell County67582233%3913
Johnson County74712230%4219
Cameron County76682229%4014
Hardin County76662229%4712
Liberty County78732228%4717
Guadalupe County84792226%5017
Jefferson County84732226%5311
Austin County54502139%2617
Wharton County55512138%2617
Grayson County63562133%3114
Jim Wells County64522133%379
Brazoria County65632132%3319
Hidalgo County75712128%4017
Atascosa County81742126%4814
Hamilton County51402039%259
Grimes County55482036%2713
Waller County56502036%2814
Webb County64532031%319
Williamson County72642028%4412
Cherokee County39361949%1716
Lubbock County50381938%247
Rusk County54541935%3019
Smith County56491934%3112
Cooke County62591931%3216
Bee County63511930%387
Hays County64571930%3812
Van Zandt County65651929%3719
Nueces County67581928%3910
Orange County68591928%4210
Camp County33241855%119
Crosby County39321846%1611
Anderson County45471840%2420
Bosque County49381837%277
Bastrop County51421835%289
San Patricio County51421835%299
Lee County55501833%3113
Aransas County61521830%369
Parker County65621828%3715
Rockwall County68651826%4215
Wise County68671826%4117
El Paso County91891820%6116
Lynn County39331744%1611
Red River County41301741%216
Brazos County43311740%215
Hunt County46411737%2212
Randall County51421733%248
Ellis County60591728%3516
Chambers County62631727%3718
Castro County32211650%135
Floyd County32251650%139
Swisher County32251650%129
Morris County36351644%1715
DeWitt County37281643%167
Terry County37311643%1610
Garza County38321642%1710
Bowie County40301640%206
Panola County40391640%2115
Montague County51471631%2912
Gregg County56501629%3410
San Jacinto County69651623%4412
Briscoe County26151558%84
Martin County33241545%146
Hopkins County34271544%168
Armstrong County35281543%168
Hockley County35311543%1511
Lamb County36311542%1510
Hale County37321541%1710
Duval County40331538%218
Titus County40341538%229
Delta County42361536%239
Wood County42451536%2318
Zapata County43401535%1912
Zavala County44361534%227
Jim Hogg County46391533%238
Potter County51441529%268
Upshur County51551529%3119
Gonzales County57541526%3612
Blanco County58541526%3611
Lampasas County59581525%3714
Navarro County59581525%3914
Travis County60561525%3811
Shackelford County29221448%117
Franklin County31341445%1417
Live Oak County33291442%1610
Refugio County39411436%2016
Cass County41421434%2415
Jack County41321434%215
Maverick County44371432%247
Coryell County47421430%279
Hood County50491428%2913
Walker County56491425%337
Motley County24161354%95
Coleman County28201346%125
Throckmorton County29221345%116
Kenedy County33271339%177
Fayette County42451331%2516
Palo Pinto County43351330%245
Bell County44381330%267
Polk County45491329%2717
Hill County48451327%2910
Mills County49471327%3111
Starr County49441327%258
Milam County57541323%3710
Kimble County19111263%64
Kent County21131257%74
Sterling County21131257%74
Borden County24161250%104
Fisher County24151250%103
Trinity County30311240%1513
Marion County33361236%1815
Rains County34321235%1810
Lavaca County35321234%209
Real County39411231%2214
Burleson County42411229%2511
La Salle County43411228%2710
Brooks County45411227%258
Nacogdoches County46441226%2910
Frio County47481226%2913
Harrison County50541224%3316
Llano County54521222%3610
Crane County20141155%85
Glasscock County20131155%74
Knox County20131155%84
McCulloch County22171150%86
Haskell County24181146%105
Schleicher County24181146%105
Kinney County25261144%1112
Runnels County25191144%115
Baylor County27221141%136
Carson County29311138%1513
Hutchinson County29281138%1510
Shelby County29231138%155
Dawson County30241137%165
McMullen County30311137%1712
Archer County31241135%164
Clay County32271134%176
Howard County35301131%216
Lamar County35301131%216
Calhoun County36331131%228
Ector County39351128%237
Goliad County40431128%2514
Leon County40451128%2516
Erath County41381127%248
Gillespie County47451123%309
Washington County47481123%3212
Tyler County48511123%3114
Fannin County52481121%327
Culberson County19121053%83
Loving County19121053%83
Menard County19141053%85
Oldham County19141053%85
Sherman County19141053%85
Stonewall County19131053%84
Upton County19141053%85
Yoakum County19141053%85
Hansford County22171045%115
Roberts County22171045%115
Dickens County24191042%105
Hall County24191042%115
Hartley County24201042%116
Stephens County24201042%116
Young County24181042%114
Bailey County25191040%124
Edwards County25281040%1213
Houston County29341034%1615
San Augustine County30261033%176
Jackson County32311031%199
Moore County34301029%176
Deaf Smith County35351029%1810
Dimmit County35331029%218
Limestone County35321029%217
Tom Green County35311029%216
Midland County37351027%228
Freestone County39441026%2515
Falls County41411024%2510
San Saba County42441024%2712
Karnes County46451022%309
McLennan County46441022%308
Somervell County47461021%319
Hudspeth County49511020%3512
Childress County159960%53
Foard County159960%53
Sutton County1813950%84
Taylor County2419938%124
Robertson County3342927%2118
Mitchell County1511853%64
Cochran County2016840%104
Coke County2118838%95
Pecos County2218836%114
Concho County2320835%125
Mason County2625831%167
Andrews County2723830%164
Madison County3442824%2216
Kerr County3639822%2311
Jasper County4047820%2615
Brewster County139754%53
Donley County1411750%64
King County1612744%83
Reagan County1614744%85
Wheeler County1613744%84
Winkler County1612744%83
Irion County1917737%95
Reeves County2017735%104
Nolan County2522728%144
Newton County2827725%186
Angelina County3537720%239
Victoria County3638719%259
Hardeman County129650%53
Presidio County1310646%63
Uvalde County2936621%1813
Dallam County1414536%85
Jeff Davis County1412536%83
Sabine County1919526%115
Callahan County2020525%125
Eastland County3131516%215
Brown County1818422%114
Wichita County1817422%123
Jones County2223418%155
Gray County2931414%186
Cottle County1212325%83
Crockett County1213325%84
Ward County1617319%104
Comanche County2120314%152
Collingsworth County810225%54
Hemphill County89225%53
Lipscomb County89225%53
Scurry County89225%53
Wilbarger County1315215%84
Gaines County79114%53
Ochiltree County79114%53
Parmer County79114%53
Terrell County79114%53
Val Verde County182816%1311

Metro areas in Texas

Abilene, TX
Amarillo, TX
Austin-Round Rock-San Marcos, TX
Beaumont-Port Arthur, TX
Brownsville-Harlingen, TX
College Station-Bryan, TX
Corpus Christi, TX
Dallas-Fort Worth-Arlington, TX
Eagle Pass, TX
El Paso, TX
Houston-Pasadena-The Woodlands, TX
Killeen-Temple, TX
Laredo, TX
Longview, TX
Lubbock, TX
McAllen-Edinburg-Mission, TX
Midland, TX
Odessa, TX
San Angelo, TX
San Antonio-New Braunfels, TX
Sherman-Denison, TX
Texarkana, TX-AR
Tyler, TX
Victoria, TX
Waco, TX
Wichita Falls, TX

Organizations leaving and joining

No Medicare Advantage plan in Texas for 2027: American Health Advantage of Texas, Blue Cross and Blue Shield of IL, NM, OK, TX, Blue Cross and Blue Shield of NM, TX, Blue Cross and Blue Shield of OK, TX, Blue Cross and Blue Shield of Texas, CHRISTUS Health Advantage, Memorial Hermann Health Plan.

New to Medicare Advantage in Texas for 2027: MedCare Partners Health Plan of Texas.

Names as they appear in the CMS file; a parent company can still offer plans under another name.

Star Ratings, insurers, Part D and Medigap in Texas

Part D: 10 stand-alone drug plans for 2027 (12 in 2026) from 5 insurers; the lowest premium $5.30 a month; 1 at $0 with full Extra Help. Every state.
Medigap: 28 insurers listed by Medicare.gov's policy search; members of a plan that is not returning can have a guaranteed right to buy a policy, applying within 63 days. The rules.
Star Ratings (2027): 215 of 386 rated plans are rated 4 stars or higher; 47 of 254 counties have no 4-star plan. Every year, Medicare evaluates plans based on a 5-star rating system. Every state.
Insurers (2026 enrollment): one insurer enrolls a majority of Medicare Advantage members in 177 of 251 counties; UnitedHealthcare is the largest in 229. Every state.
Special Needs Plans (2027): 119 D-SNPs for people with Medicare and Medicaid (+20 from 2026), 67 chronic condition plans (+23) and 7 institutional plans; 254 of 254 counties have a D-SNP. Every state.
Medicare fraud: 8 guilty pleas, convictions and sentences announced since January 1, 2025 ($503.9 million in the headlines); 5,943 people and companies here on the federal exclusion list. Every state.
Localize it: the Story Localizer writes any Texas county's story from these numbers, and the County Explorer sorts and filters them.

Put the county lookup on your site

Readers pick their county and see what changes for them. Paste this where the lookup should go; it works in any story page, newsletter archive or resource page, and needs no account.

<iframe src="https://mymedicareplans.org/embed/plan-changes/?state=texas" title="Medicare Advantage plan changes for 2027, by county" width="100%" height="440" style="border:0;max-width:640px" loading="lazy" allowtransparency="true" data-mmp-embed></iframe>
<script src="https://mymedicareplans.org/embed/resize.js" async></script>
<p style="font:13px/1.4 sans-serif;margin:4px 0 0">Medicare Advantage plan changes for 2027 by county: <a href="https://mymedicareplans.org/newsroom/texas/">MyMedicarePlans.org</a></p>

For your readers

Texas plan changes by county and Medicare Advantage in Texas, the site's pages for people choosing a plan; Open/Annual Enrollment 2027, the dates and rules.

How the counts are made

A comparison of the CMS Landscape file for 2026 and the CMS Landscape file for 2027 for 2026 and 2027, built 2026-11-16. Definitions, caveats and the national file: the newsroom's methodology.

Questions about the data

Write to [email protected]: a custom cut of the data (a county list, a region, a chart in your outlet's size) is usually a same-day reply.

For a quote or an interview, write to the same address and the desk that covers it answers: the Data Desk for the plan counts and the county data, the Costs & Policy Desk for Part D, premiums, IRMAA and Extra Help, the Editorial Desk for how Medicare works, Medigap and enrollment. Every answer comes from the CMS files and Medicare's own rules.

MyMedicarePlans.org is a Medicare guide: plain-language answers and plan data for people choosing coverage. The counts here come only from the CMS files, and the method is above. Not connected with or endorsed by the U.S. government or the federal Medicare program.